Bloomberg Visual Data | Prototypes
This site collects archived versions of projects developed by Christian Swinehart for Lisa Strausfeld’s Visual Data team at Bloomberg. They were designed in collaboration with Lead Designer Hilla Katki, with Christian’s contributions focusing on interaction, animation, and data visualization design.
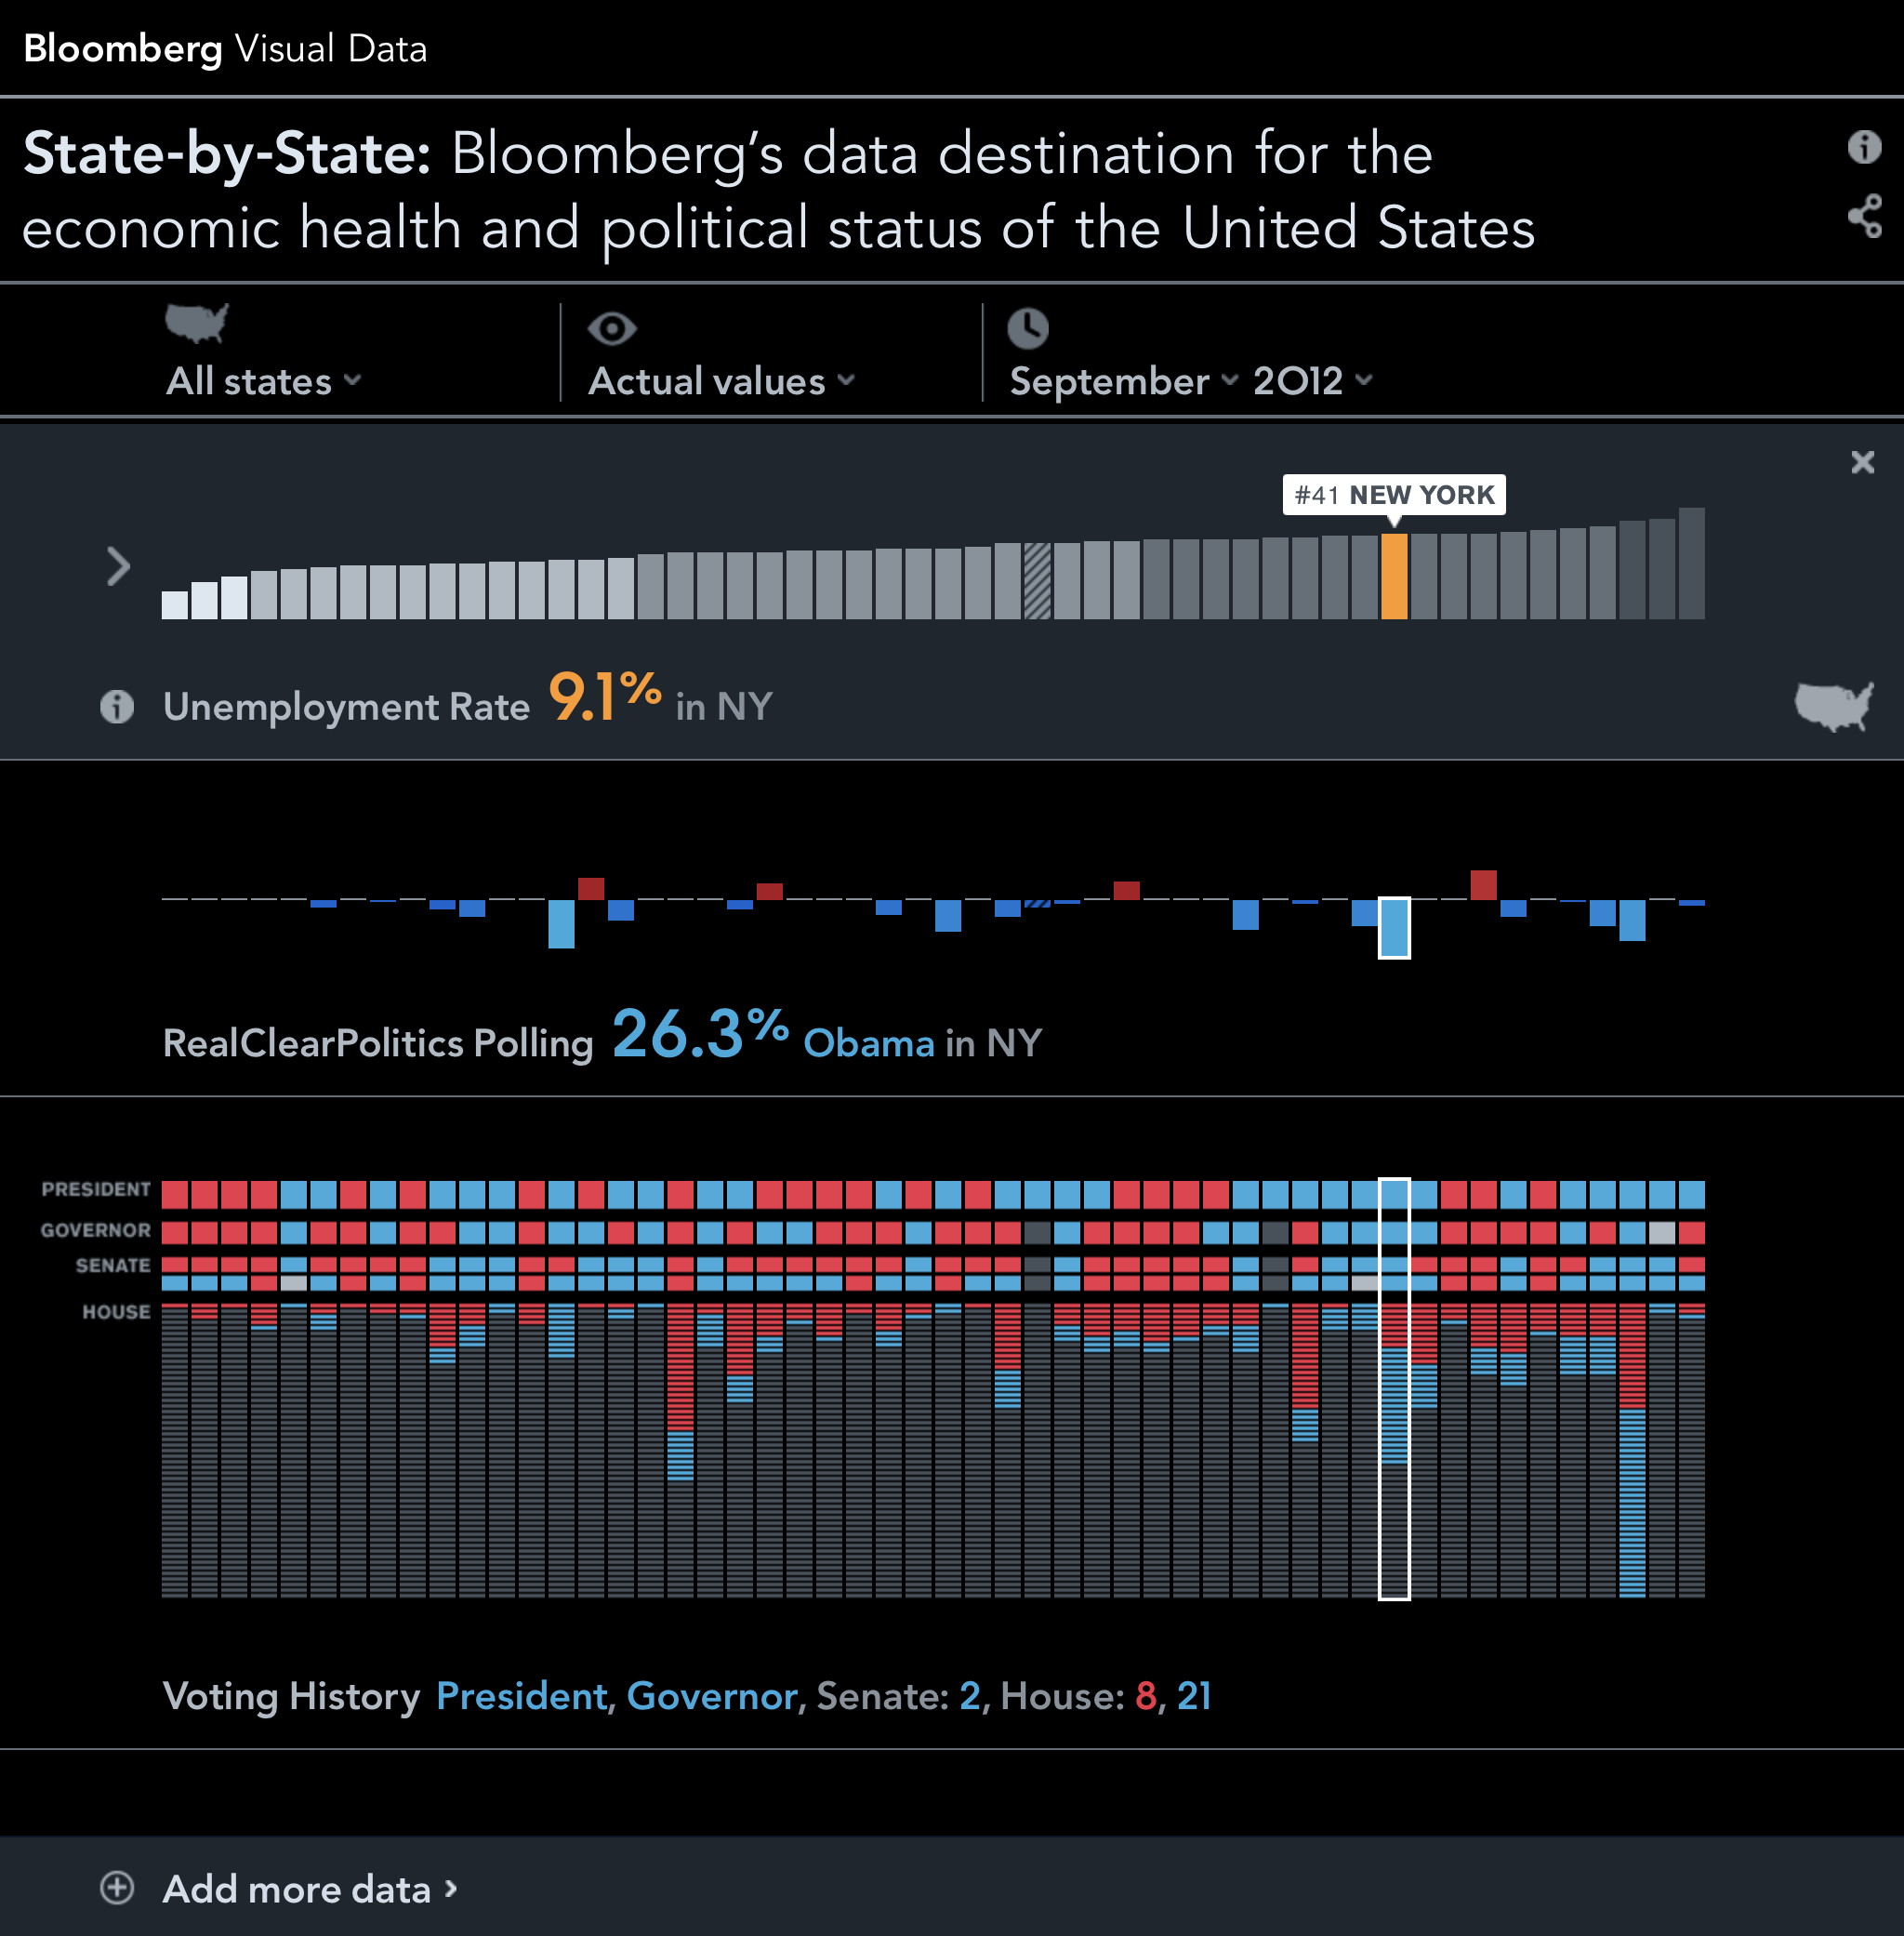
State by State
2012
Built in the lead-up to the 2012 election, the State by State dashboard showed the United States as a spectrum of fifty isolated states. Selecting a particular metric would reorder all the states, inviting emergent discovery of correlations with other attributes.
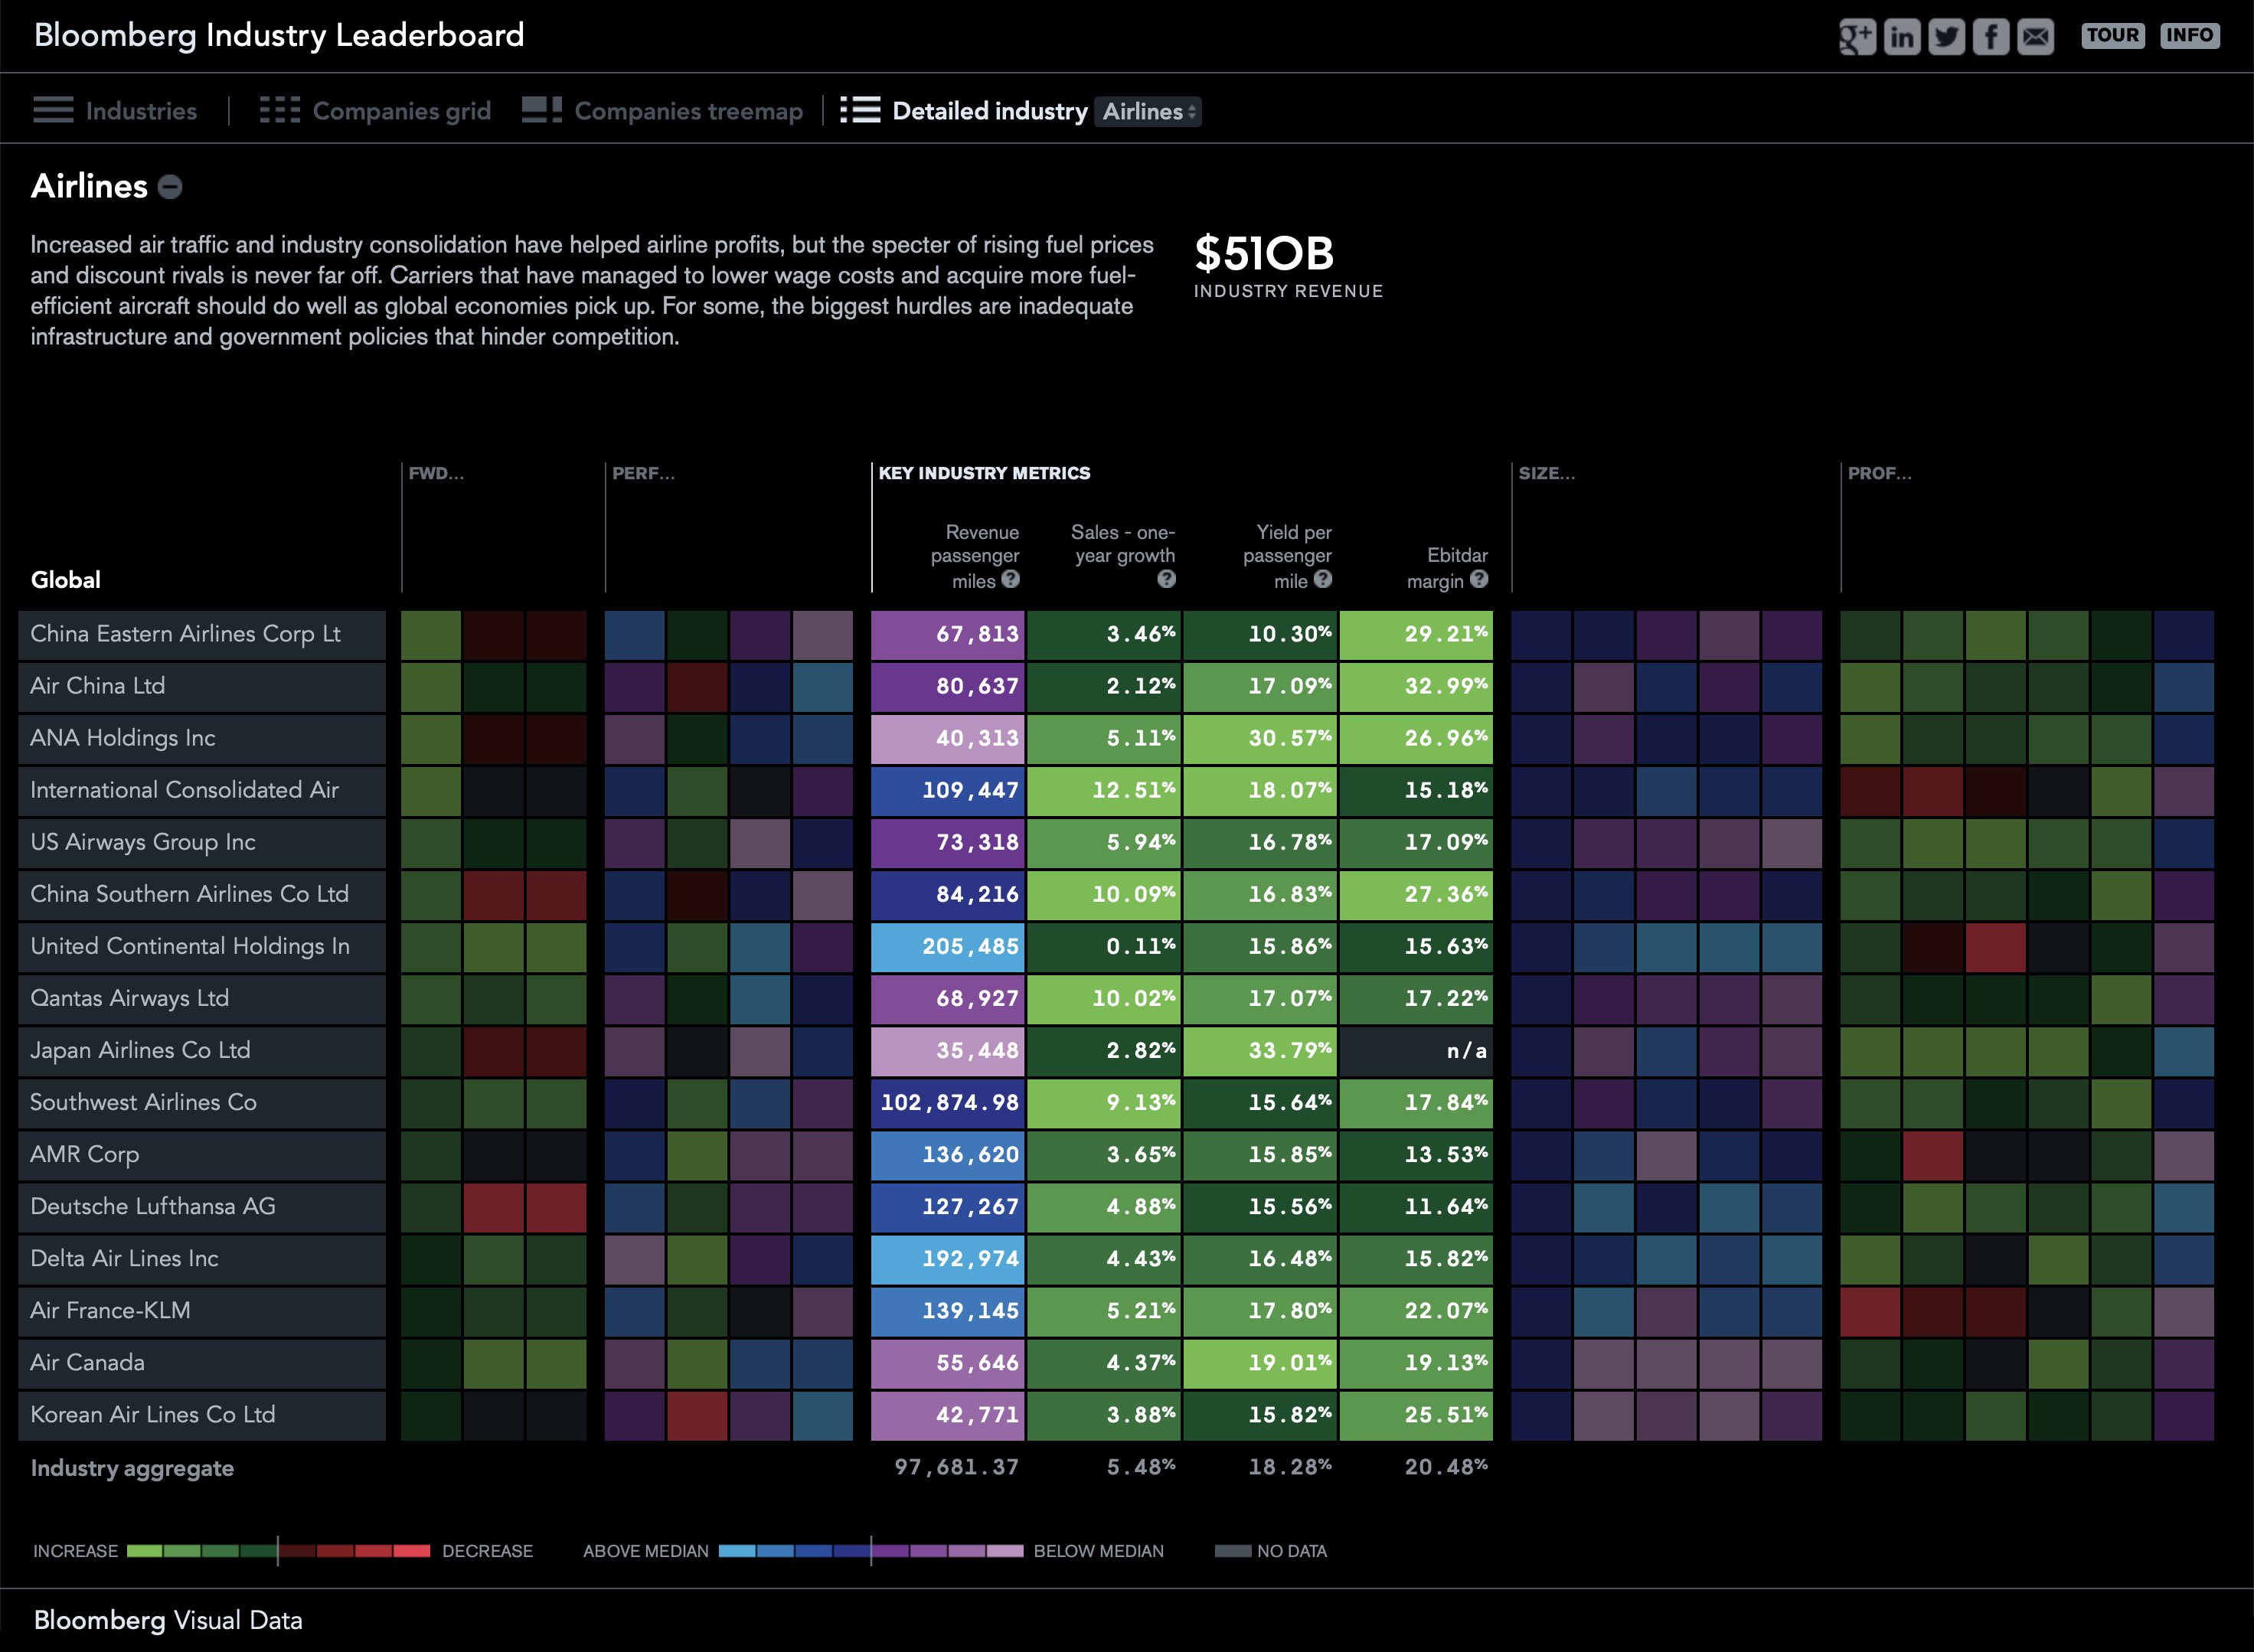
Industry Leaderboard
2013
The Industry Leaderboard provides an at-a-glance summary of the different industries in the world economy and the relative positions of the companies that compose them.
Color, scale, and ordering allow for the most salient information to bubble up.
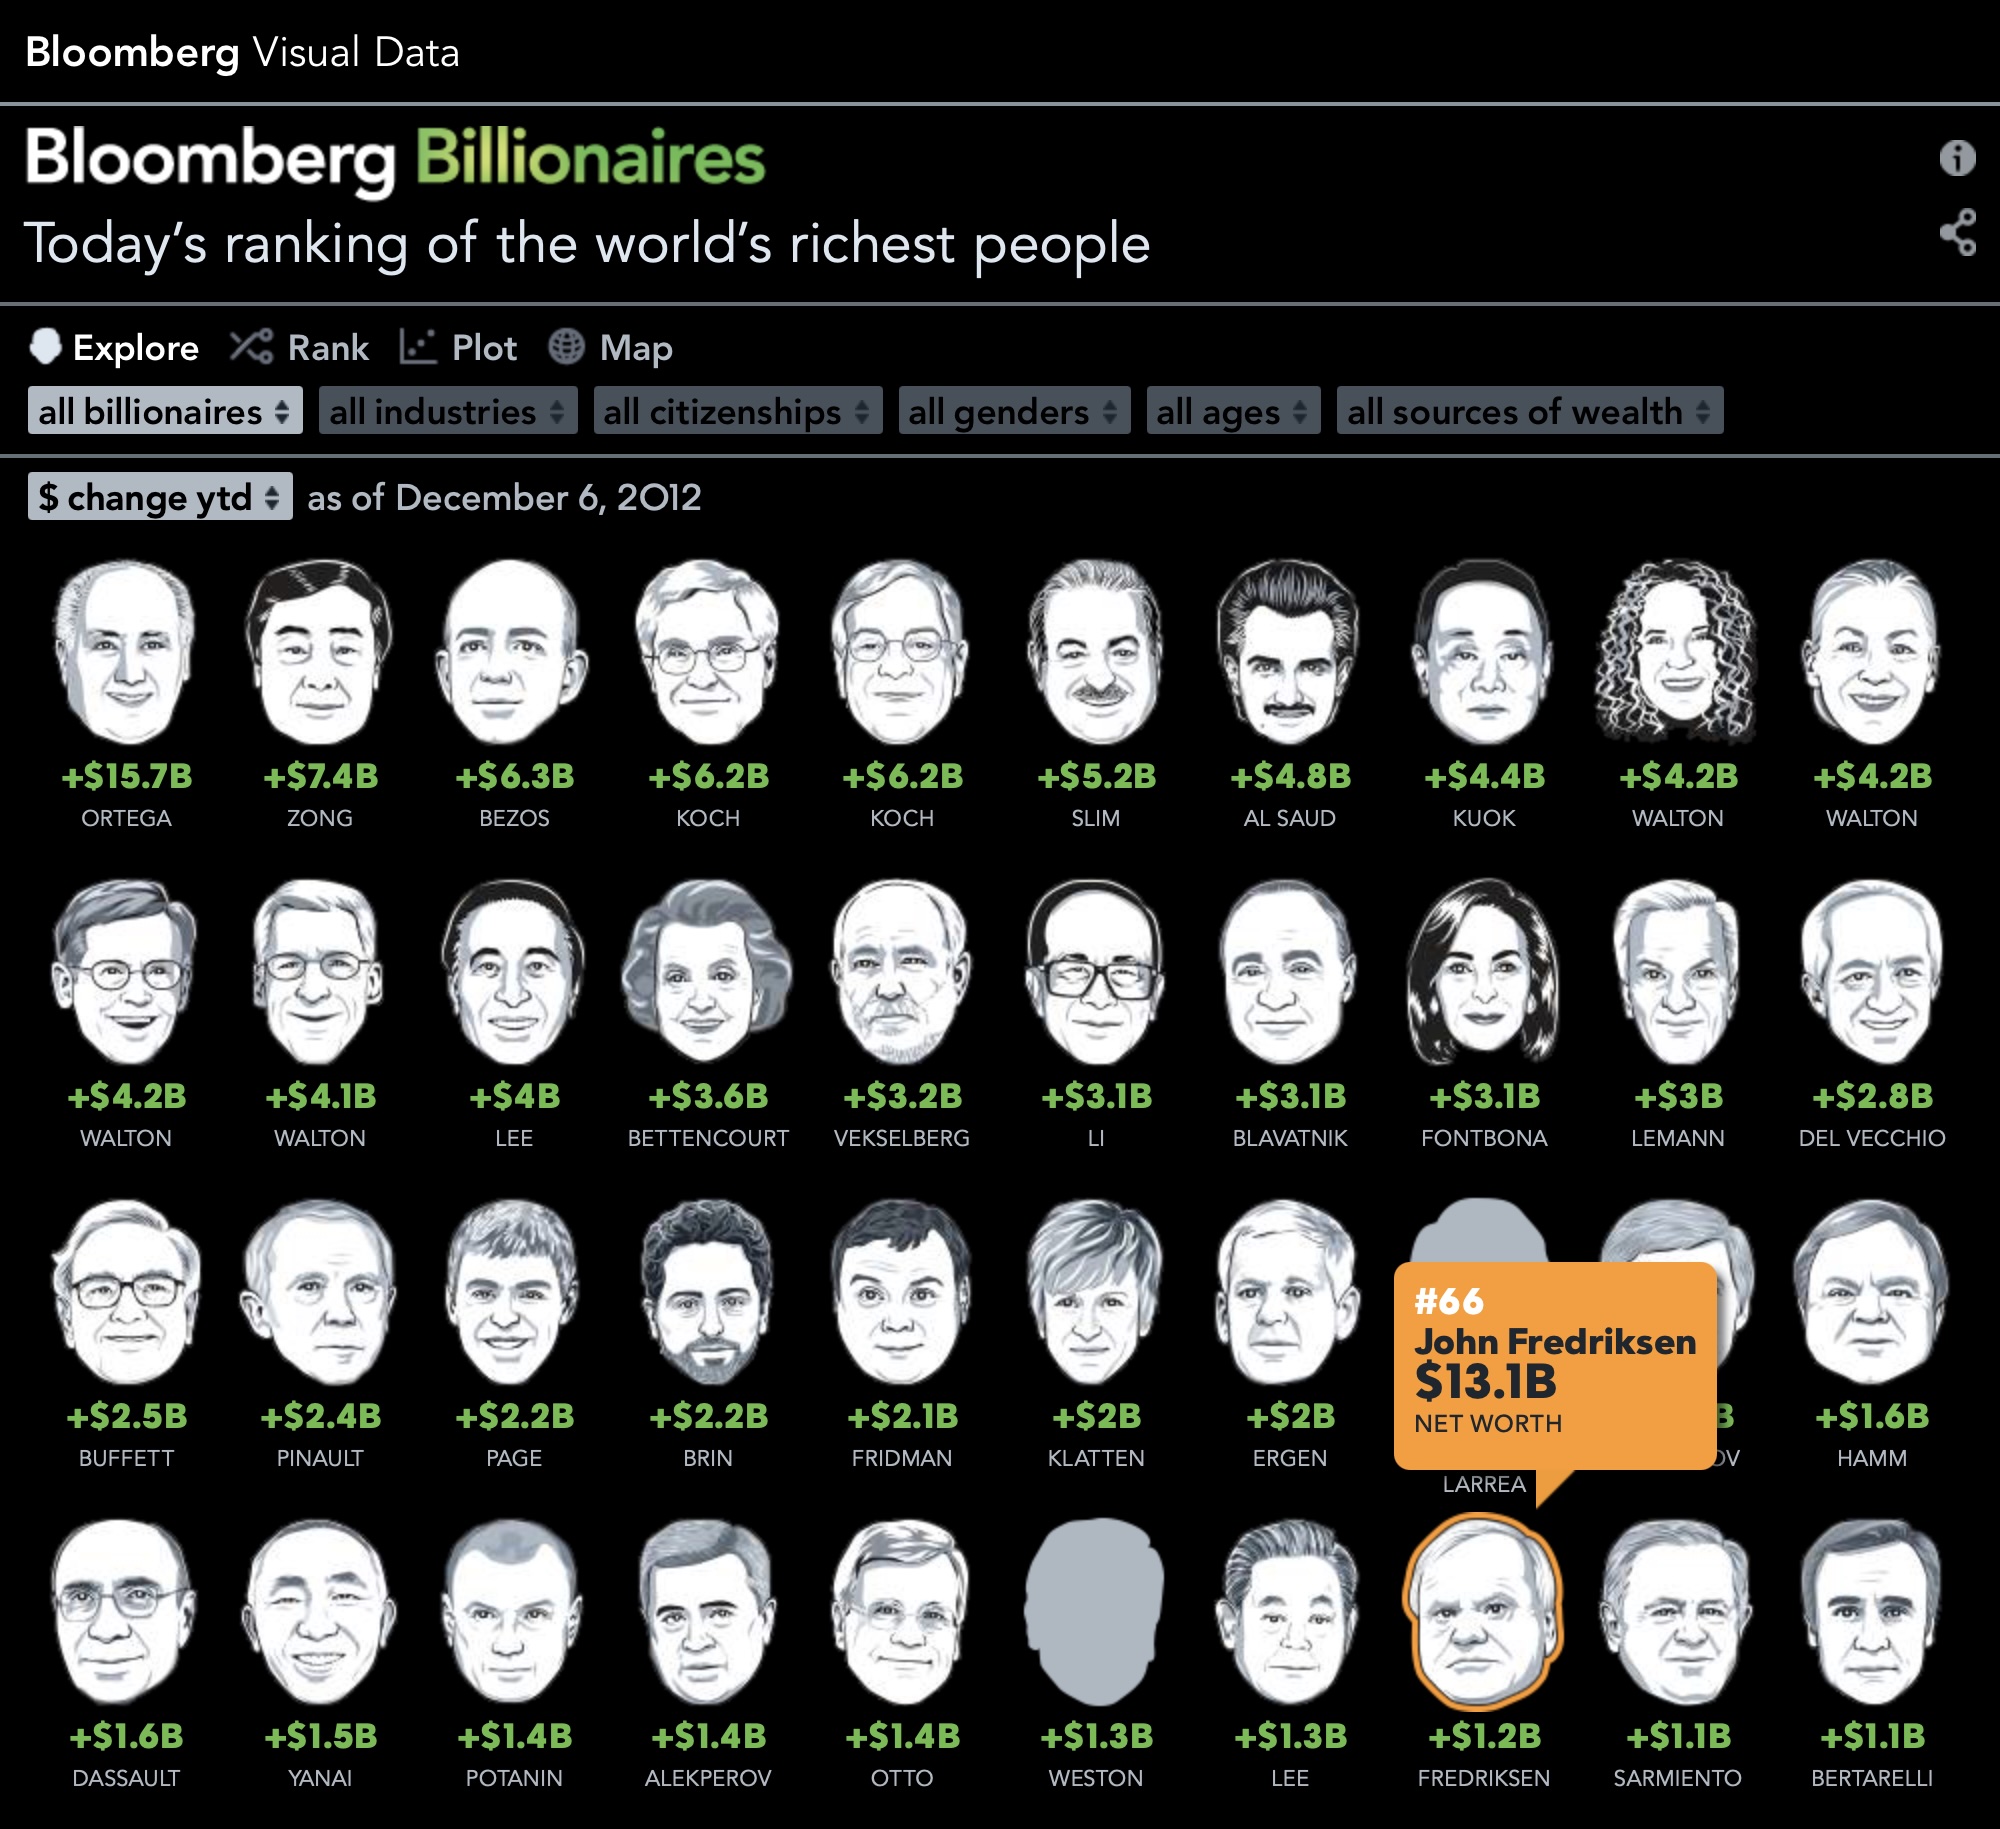
Billionaires Index
2013
The Billionaires Index is a continually updated ranking of the world’s richest people. The data can be sorted and filtered based on demographics, industry, and family background. The different chart types give different views of the changes in the index over time.